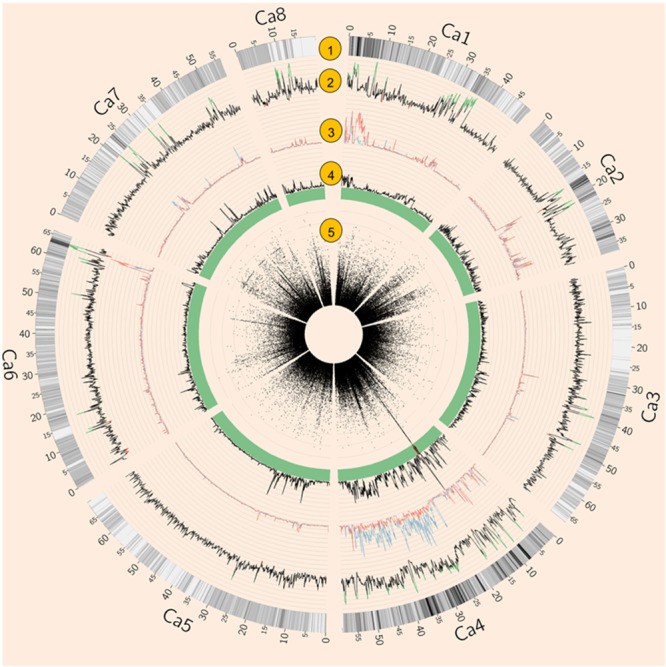
FIGURE 2.

Summary of whole genome re-sequencing (WGRS) data. (1) SNP density. (2) Tajima’s D of 64 Australian varieties and four Indian landraces. Values above 2 are highlighted in green while values below –2 are in red. (3) Nucleotide diversity (𝜃π) of AB susceptible (blue) and resistant (red) varieties. (4) Fst of AB susceptible versus resistant varieties. (5) Circular Manhattan plot of genome-wide association studies (GWAS) result. Each black dot represents a SNP, Red dots represent SNPs with p-values lower than 3. 47E-04 (equal to 0.05 with modified Bonferroni correction).
