
FIGURE 3.
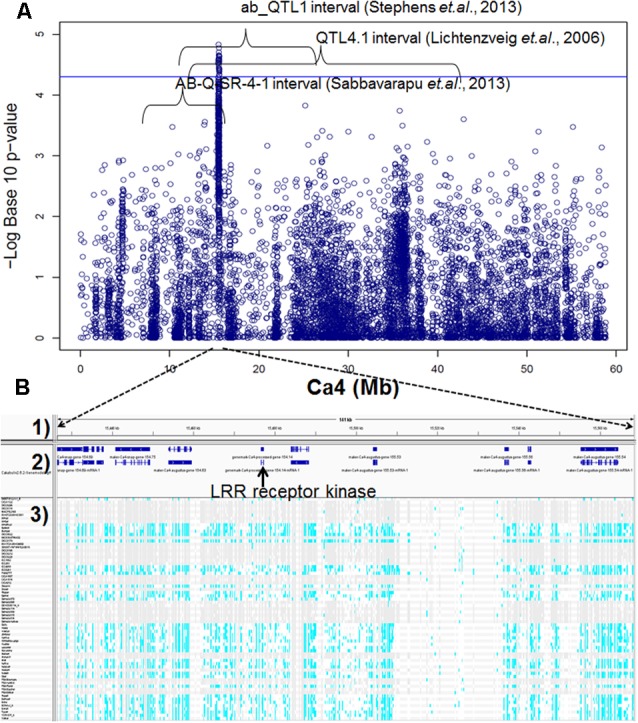
(A) Manhattan plot of GWAS result on Ca4. Twenty SNPs, significantly associated with AB resistance, were located within three AB resistant QTL intervals discovered previously by bi-parental mapping. (B) Predicted genes and SNPs in AB4.1 associated with AB resistance. (1) Physical position. (2) Predicted genes. (3) SNPs of 69 genotypes in AB4.1, gray represents reference allele, light blue represents alternative allele, and white represents missing.