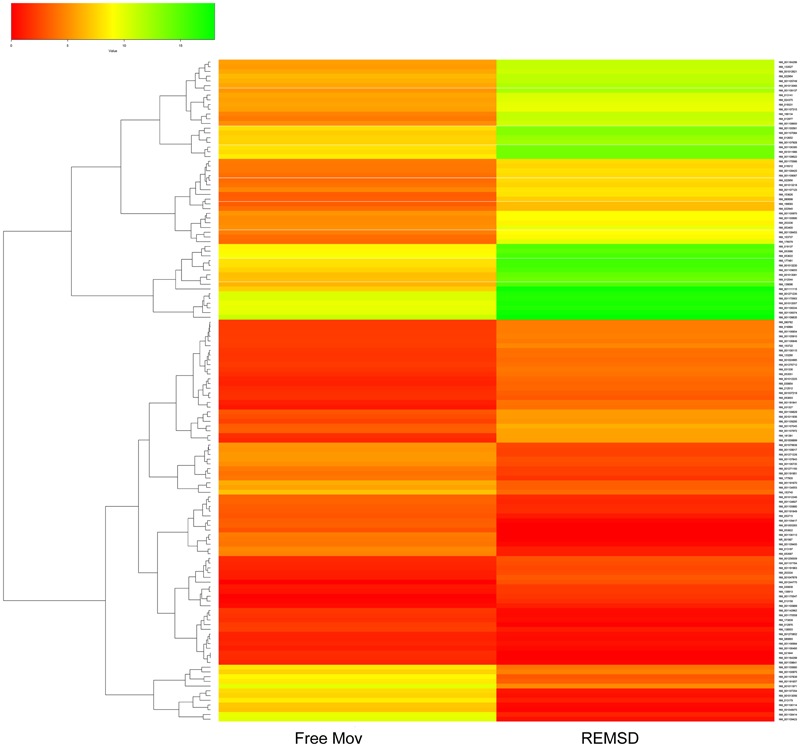
FIGURE 2.

Heat Map of differentially expressed genes (DEGs). Clustered heat Map depicting DEGs after 96 h of selective REMSD as compared with Free Mov control. A total of 216 genes showing significantly altered gene expression (P < 0.05); out of which 80 genes were up-regulated and 136 genes were down-regulated upon REMSD.
