
FIGURE 4.
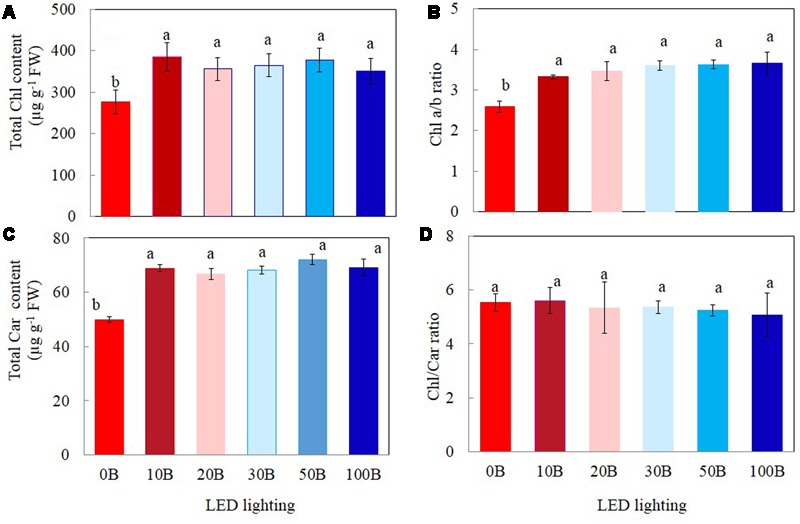
Total Chl content (A), Chl a/b ratio (B), total Car content (C), and Chl/Car ratio (D) of M. crystallinum grown under different combinations of red- and blue-LED lightings for 21 days. Values are means ± standard errors. Means with different letters are statistically different (P < 0.05; n = 4) as determined by Tukey’s multiple comparison test.