FIGURE 1.

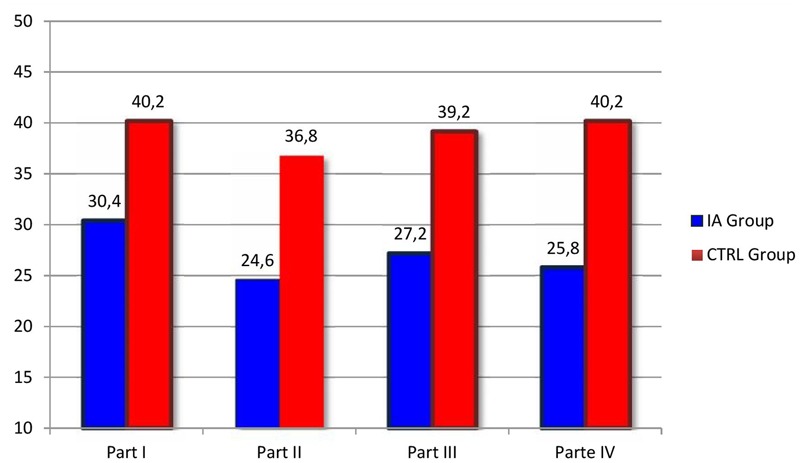
Comparison between the four parts of the LTP in the IA Group and in the CTRL Group during the Feeding context. The columns in evidence indicate the LTP parts where statistically significant differences between the two groups were found.

Comparison between the four parts of the LTP in the IA Group and in the CTRL Group during the Feeding context. The columns in evidence indicate the LTP parts where statistically significant differences between the two groups were found.