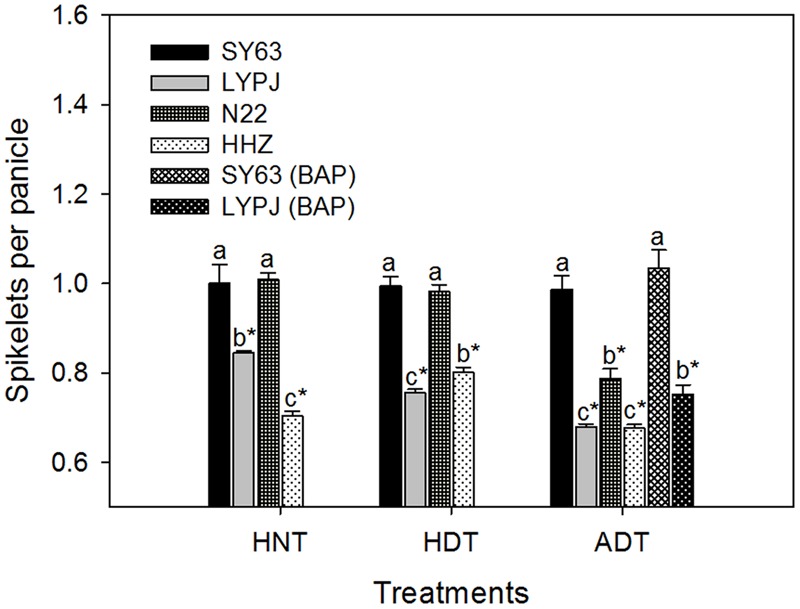
FIGURE 2.

Relative number of spikelets per panicle of rice varieties under high temperature treatments. Data are presented as mean ± SD (n = 4). Different letters indicate significant differences among varieties under the same temperature treatment by a least significant difference (LSD) test at P < 0.05. Asterisks indicate significant differences when comparing the absolute mean of a trait under a given high temperature treatment with that under the control by LSD test at P < 0.05.
