FIGURE 4.

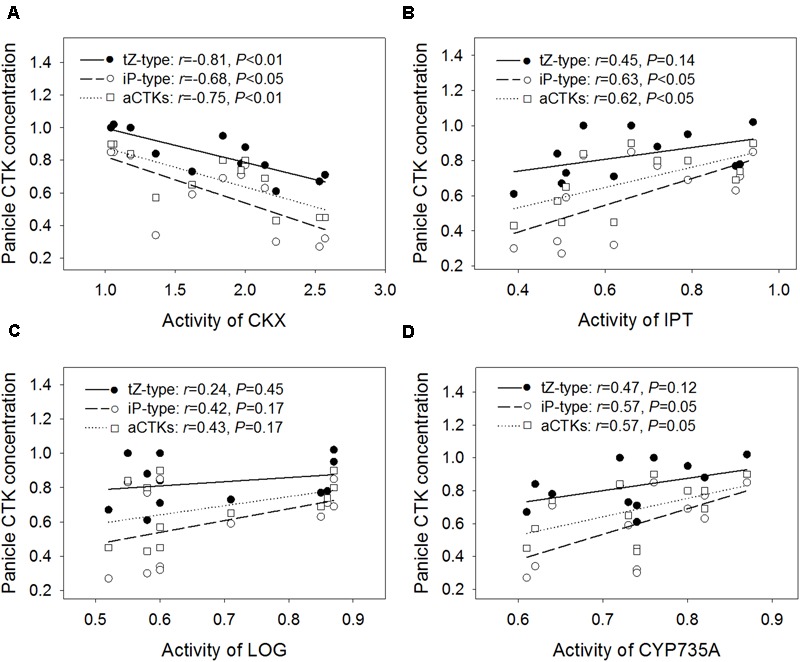
Regression analysis for the relative activity levels of CKX (A), IPT (B), LOG (C), and CYP735A (D) with the relative concentration of panicle CTKs across four varieties and three high temperature treatments.

Regression analysis for the relative activity levels of CKX (A), IPT (B), LOG (C), and CYP735A (D) with the relative concentration of panicle CTKs across four varieties and three high temperature treatments.