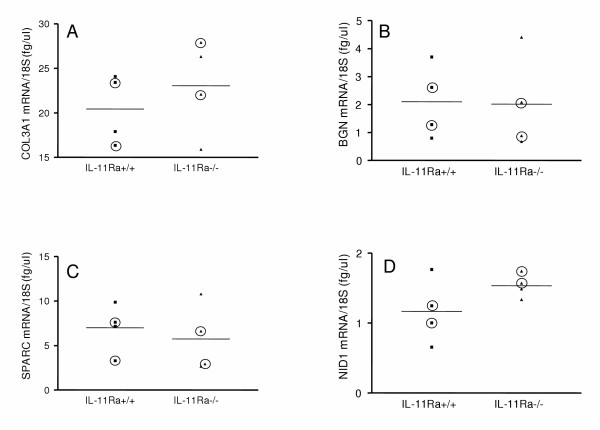
Figure 3.
Quantitative real-time RT-PCR for extracellular matrix components. Quantitative real-time RT-PCR for (A) COL3A1, (B) BGN, (C) SPARC and (D) NID1. Circled data points indicate samples used in the cDNA microarray analysis, and horizontal lines the mean of each genotype. Absolute values for mRNA abundance were normalized to that of 18S rRNA.

