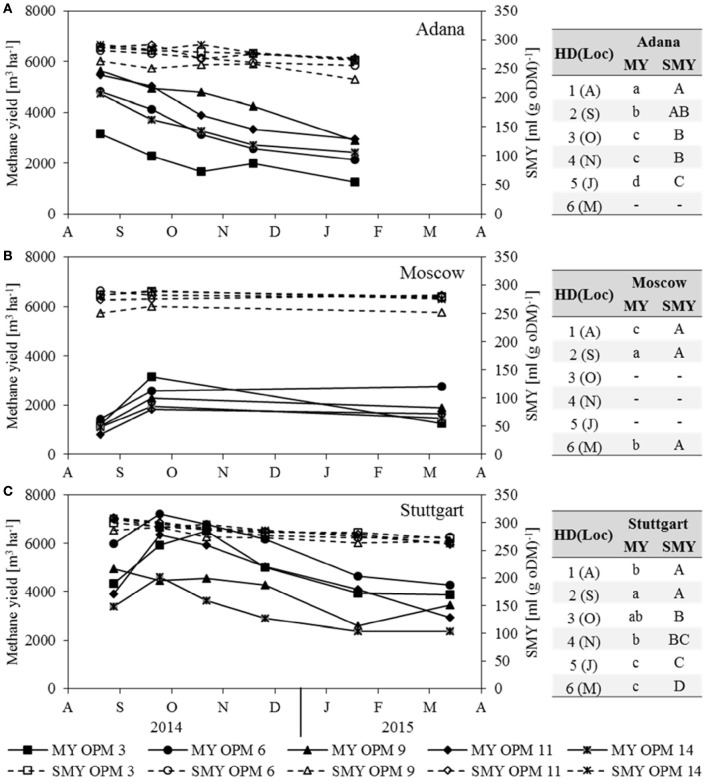
Figure 3.
Methane yield (MY) and substrate-specific methane yield (SMY) for each genotype [OPM 3, 6, 9, 11, 14) and sampling date (1 = August (A), 2 = September (S), 3 = October (O), 4 = November (N), 5 = January (J), 6 = March (M)] at the locations (A) Adana, (B) Moscow and (C) Stuttgart. Tables include the letter display for the sampling date per location [HD(Loc)] for the traits methane yield (MY) and substrate-specific methane yield (SMY). Different lower- (MY) and upper-case (SMY) letters indicate significant differences at a probability level of α = 0.05 for sampling dates at a specific location.

