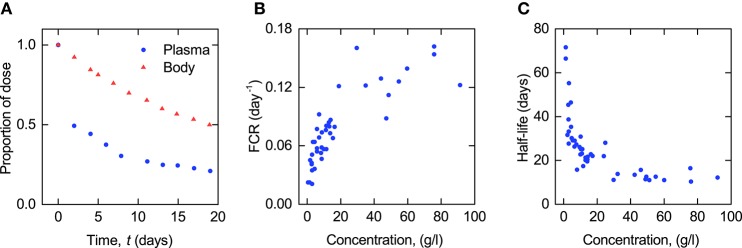
Figure 1.
(A) Proportion of administered IgG remaining in plasma (blue circles) and the body (red triangles) in a typical normal subject; data from Solomon et al. (1963). Plasma concentration dependence of (B) fractional catabolic rate (FCR) and (C) half-life (T½) of IgG; redrawn from Waldmann and Strober (1969) with permission from S. Karger AG, Basel.

