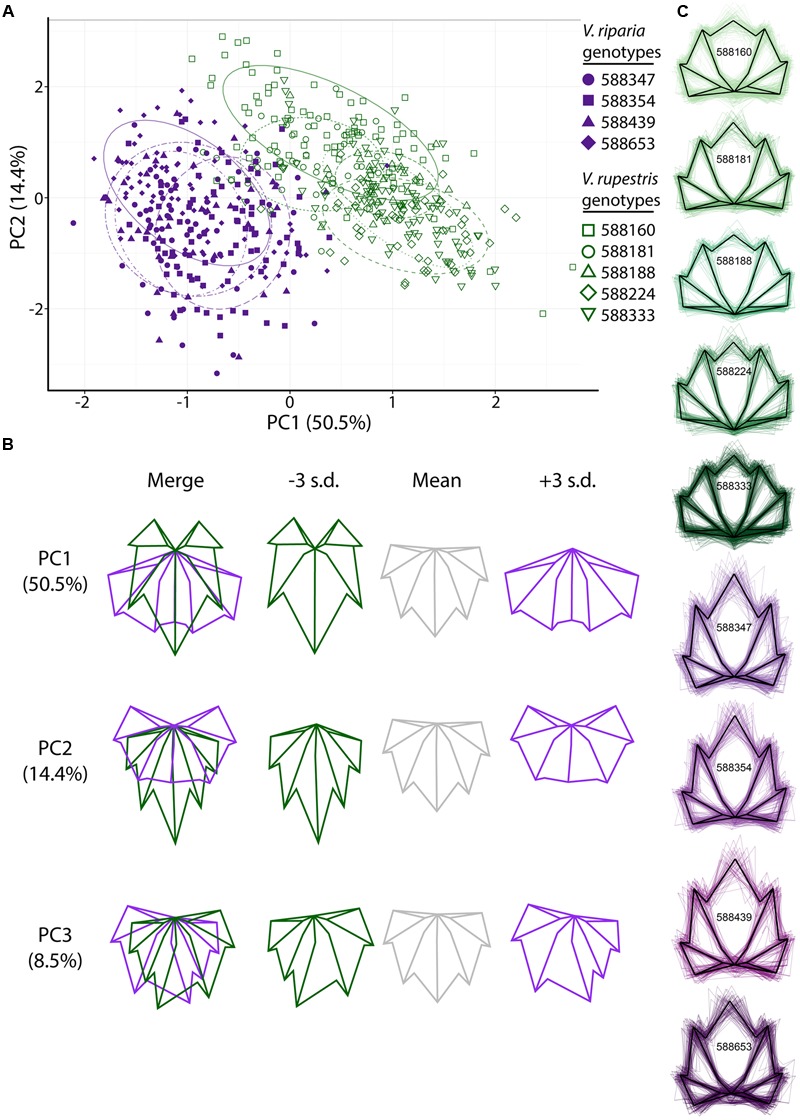
FIGURE 2.

Generalized Procrustes analysis (GPA) of 17 landmark points applied to leaves harvested from the MBG common garden principal components (PC) morphospace. (A) PCs 1 and 2 of Vitis riparia (purple, filled) and V. rupestris (green, open) leaves. Different shapes represent genotypes (see legend). The 95% confidence ellipses drawn around each genotype are designated by different dashed patterns for each genotype. (B) ‘Eigenleaves’ display differences among mean leaf morphologies in PCs 1–3 at ±3 SD and percent shape variance for each. (C) Black outline represents the average shape outline of each V. riparia and V. rupestris genotype, with all outlines super imposed beneath in purple and green, respectively.
