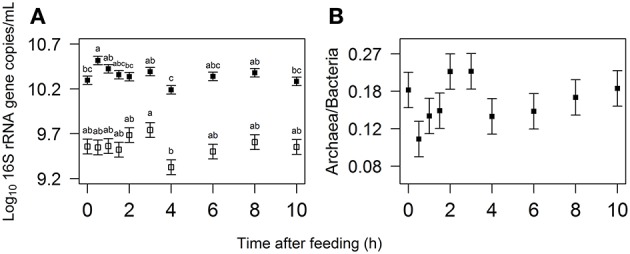
Figure 3.

(A) Log10 transformed bacterial (closed squares) and archaeal (open symbols) 16S rRNA gene concentration and (B) back-transformed archaea to bacteria ratio in the rumen over the first 10 h after feeding with a y-axis that is plotted on a log scale. Values represent least square mean (LSM) ± standard error, with different letters indicating significant differences in time (P < 0.05).
