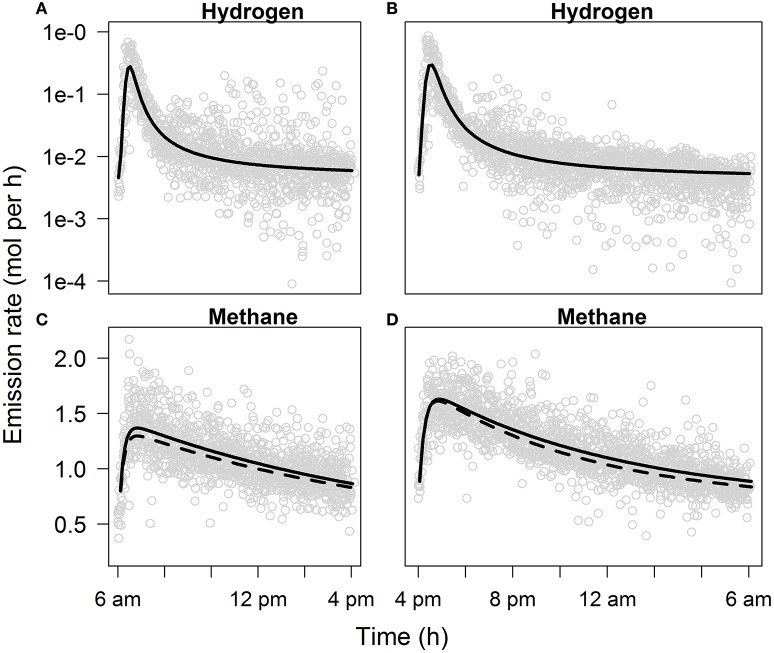
Figure 4.
Gas emission rates as a function of time from feeding. The graph shows (A) daytime (from morning feeding at 6 a.m. to afternoon feeding at 4 p.m.) and (B) overnight (from afternoon feeding at 4 p.m. to morning feeding at 6 a.m.) back-transformed H2 emission rate plotted on a log scale predicted with a hyperbolic model, and (C) daytime and (D) overnight CH4 emission rate predicted with a double exponential model. H2 emission rate was not affected by dietary treatment, CH4 emission rate was affected by dietary treatment (solid line for control diet, dashed line for linseed oil diet). See Table S4 for model parameters.

