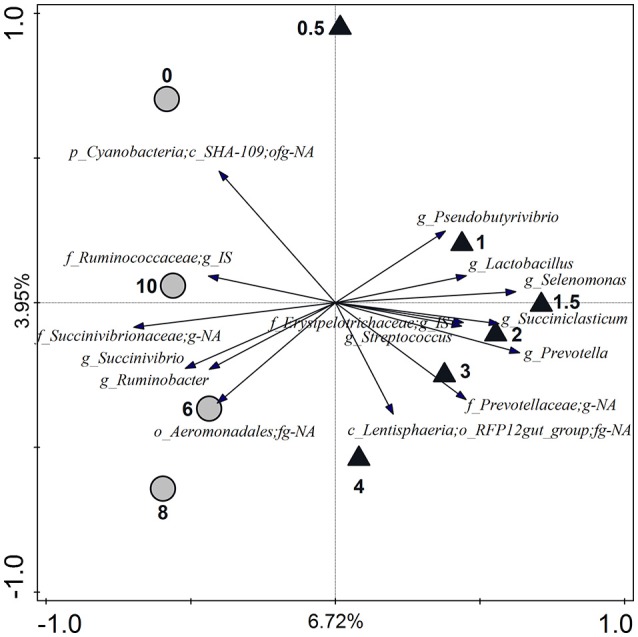
Figure 6.

Redundancy analysis triplot showing the relationship between the top 15 genus-level phylogenetic groupings of the OTUs explaining the variance with time. The canonical axes are labeled with the percentage of the total variation accounted for with respect to the explanatory variable time. Time points (0–10 h) are indicated relative to the ruminal concentration of metabolites being either high (total VFA + lactate + ethanol > 90 mM or peaks in PH2 and PCO2, triangles) or low (all other concentrations, circles). Arrow length indicates the variance that can be explained by the parameter time, with the perpendicular distance of the time points to the arrow indicating the relative abundance of the genus-level phylogenetic grouping. Arrow labels indicate the taxonomic affiliation of genus-level phylogenetic groups, with the level [i.e., kingdom (k), phylum (p), class (c), order (o), family (f), or genus (g)] and taxon (as defined by the Silva 16S rRNA database) that the groups could be reliably assigned to. For example “g_Prevotella” represents an OTU reliably assigned to the Prevotella genus, whereas “p_Cyanobacteria;c_SHA-109;ofg-NA” was reliably assigned to the class SHA-109 but the order, family, and genus could not be annotated (NA). IS, Incertae Sedis.
