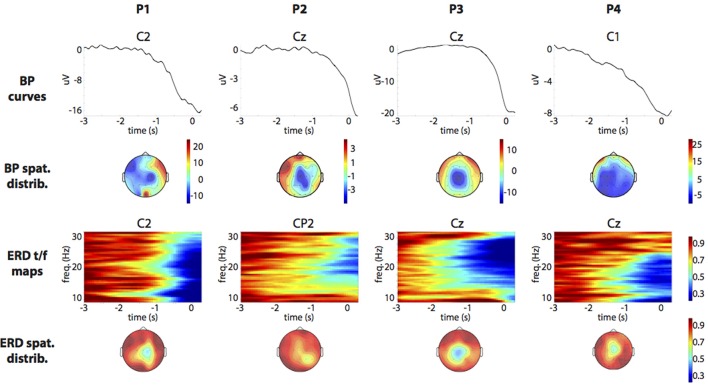
Figure 3.
Patients' ERD (8–30 Hz) and BP (0.05–1 Hz) patterns. To optimize visualization, baseline was defined within [−3,−2] s and [−5,−3] s for BP and ERD, respectively. Average referencing was used for BP. Small Laplacian filters were used for ERD. BP and ERD of the most reactive EEG channels are shown in rows 1 and 3.

