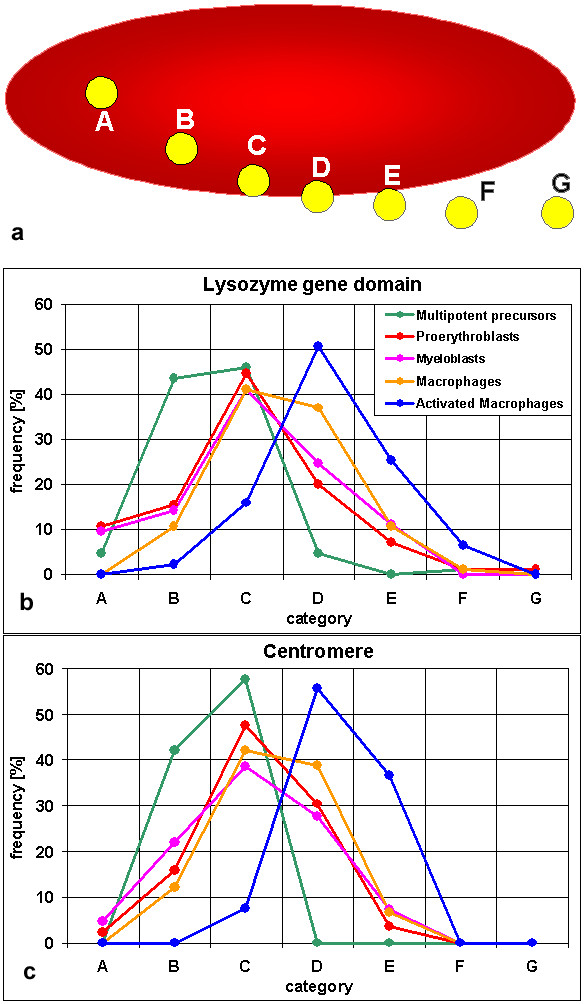
Figure 6.

Classification of cLys gene domain and centromere signals. (a) Scheme used to classify the localization of gene and centromere signals relative to their chromosome 1 territory [adopted from 11]. The red ellipsoid represents the territory, the yellow dots the signals of genes or centromeres. Categories are: A, inside the territory delineated by the paint probe, away from the surface. B, inside, closer to the territory surface but not touching it. C, inside and touching the surface. D, on the surface. E, outside and touching the surface. F, without contact to the territory but in immediate neighborhood. G, away from the territory. (b, c) Distribution of the lysozyme gene domain (b) and the centromere (c) relative to the chromosome 1 territory in 5 different cell types. Between 79 and 95 cLys gene domain and centromere signals were evaluated for each cell line and assigned to the categories A-G.
