
Figure 4.
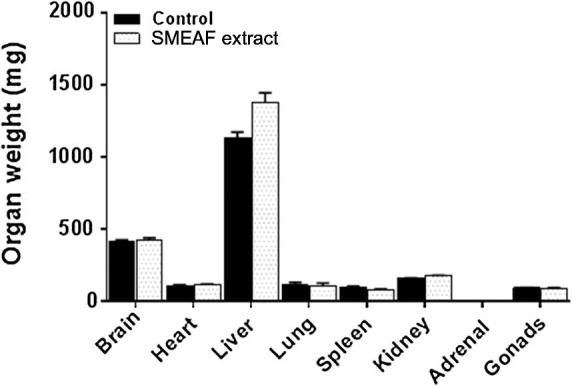
Organ weight of mice after 14 days of study (n = 6). Data are expressed as mean ± SEM and analyzed by t-test (p < 0.05) as compared to that of the control group.
Official websites use .gov
A
.gov website belongs to an official
government organization in the United States.
Secure .gov websites use HTTPS
A lock (
) or https:// means you've safely
connected to the .gov website. Share sensitive
information only on official, secure websites.
Organ weight of mice after 14 days of study (n = 6). Data are expressed as mean ± SEM and analyzed by t-test (p < 0.05) as compared to that of the control group.