
Figure 8.
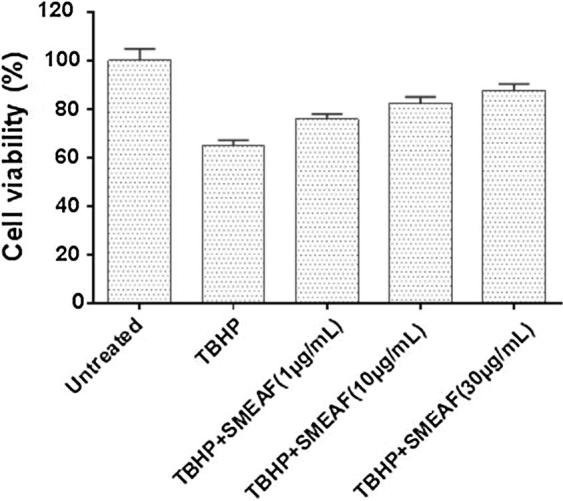
Effect of SMEAF on TBHP treated cell viability in primary neuronal culture (n = 6) at 1 μg/mL, 10 μg/mL and 30 μg/mL concentrations. Data are expressed as Mean ± SEM and analyzed by ANOVA, followed by Dunnet’s test (∗p < 0.05; ∗∗p < 0.01; ∗∗∗p < 0.001) for each concentration with respect to the TBHP treated group.