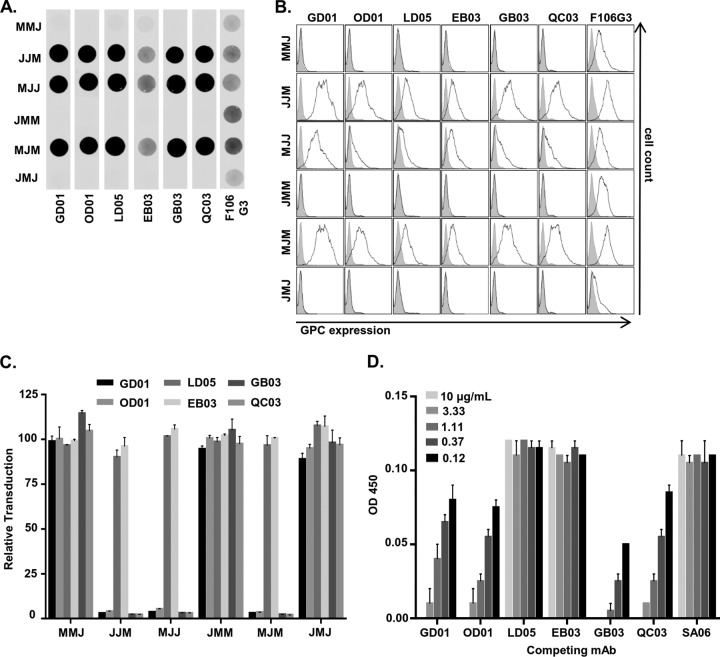
FIG 3.
JUNV GP1 is the target of both neutralizing and nonneutralizing MAbs. (A) Dot blot analysis of nondenatured M/J chimera-VSV-associated GPCs. Pseudoviruses were incubated with lysis buffer prior to direct application to nitrocellulose. Blots were incubated with either a 1:500 dilution of each α-JUNV GPC MAb or a 1:20 dilution of each α-MACV GP2 MAb. (B) Cell surface expression analysis of M/J chimera-expressing 293T cells. Cells were transfected with GPC-containing plasmids 48 h prior to staining with a 1:50 dilution of each α-JUNV GPC MAb or a 1.5:2 dilution of α-MACV GP2 MAb. Filled histograms represent cells transfected with empty vector; unfilled histograms represent cells transfected with the respective GPC plasmids. (C) Neutralization assays were performed to assess the capacity of each α-JUNV GPC MAb to inhibit M/J chimera-VSV transduction. Pseudovirions were incubated with each MAb at 0.5 μg/ml prior to application to Vero cells. Transduction is represented as the percentage of GFP-positive cells relative to cells incubated with nonspecific MAb, as assessed by flow cytometry. Bars are representative of two or three independent experiments with the indicated SEM. The results shown in panels A to C were determined contemporaneously with the findings depicted in Fig. 1A to C, and the relevant positive control results are also shown in those panels. (D) An ELISA assessing the capacity of each α-JUNV GPC MAb to compete with MAb GD01 for the receptor binding site of JUNV GP1 was performed. JUNV-VSV-coated ELISA plate wells were incubated with 0.5 μg of biotinylated GD01/ml mixed with decreasing concentrations of nonbiotinylated forms of each of the six JUNV GP1-specific MAbs or a nonspecific control (SA06) (concentrations were as indicated in the inset key). Plates were developed in TMB after incubation with a 1:4,000 dilution of HRP-conjugated streptavidin, and the results are presented as units of optical density at 450 nm. Bars are representative of two independent experiments with the indicated SEM.

