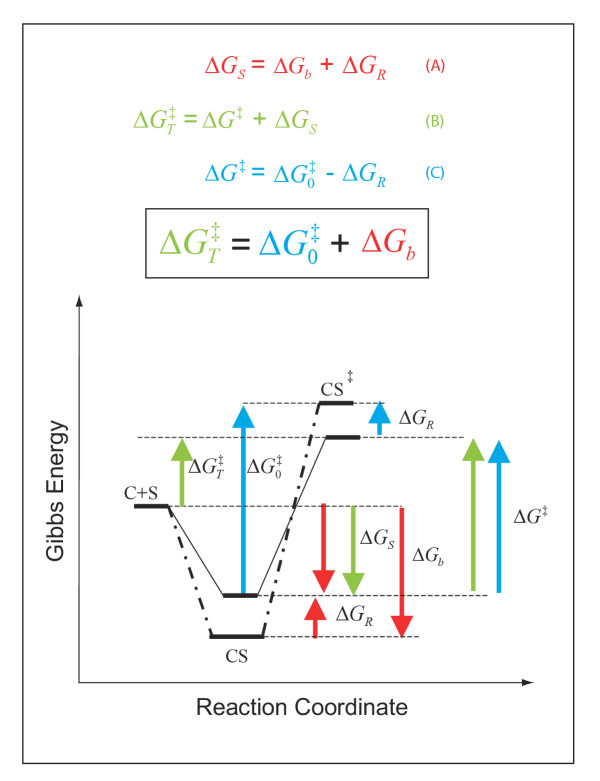
Figure 5.
Changes in catalytic specificity (kcat/Km) reflect underlying changes in transition state binding energy (ΔGb) In this description of catalysis, (i) the magnitude of the non-catalysed activation energy ( ) does not depend on a favourable protein-substrate interaction in the transition state, (ii) the catalysed translocation energy barrier is taken as the Gibbs Energy difference (
 ) between the free reactants (C + S) and the transition state complex (CS‡), and (iii) intrinsic substrate binding energy is recognizable as the decisive factor in transition state stabilization. Thus, translocation catalysts (C) will use intrinsic substrate binding energy (ΔGb) to stabilize the transition state (CS‡). The role of ΔGb in lowering the transition state energy barrier compared to a non-catalyzed reaction (
 ) may be deduced with aid from the accompanying energy diagrams, which emphasize several instances wherein the thermodynamic distance represented by one coloured arrow equals the summed distance represented by two shorter arrows of the same colour. The illustrated thermodynamic relationships are restated (with proper attention to sign convention) in equations A (red), B (green), and C (blue). Substituting A and C into B yields the fundamental relationship,
  (boxed), which says that the uncatalysed activation energy (
 , algebraically positive) is diminished by intrinsic substrate binding energy, ΔGb (algebraically negative), which is the underlying parameter that TSR analysis probes (Eqn. 9). Note: These energy diagrams compare non-catalytic (dots and dashes) and catalytic (solid line) proteins. Imposition of a binding-averse interaction (ΔGR) is seen to de-stabilize the Michaelis complex (CS, red arrows) in the catalytic protein. Subsequent attainment of favourable transition state complementarity (i.e., via conformational transitions that relieve ΔGR , blue arrows) results in use of binding energy to stabilize the transition state complex (CS‡). This internal ''give-and-take,'' involving ΔGR is reflected in its algebraic cancellation when equations A, B, and C are combined to yield the boxed equation (text Eqn. 1), which says that intrinsic substrate binding energy decreases the energy barrier (
 ) for a translocation reaction carried out from solution (i.e., directly from the free carrier and substrate (C + S) to the transition state). When C and S are free in solution, the effective second-order rate constant associated with
  is kcat/Km, the specificity parameter compared in the dual-substrate TSR analysis (Equation.5). That kcat/Km should be associated with the free reactants may be appreciated by considering the Michaelis-Menten Equation when S << Km, and CS complexes do not exist in appreciable amounts (see Discussion).

