FIG 4.
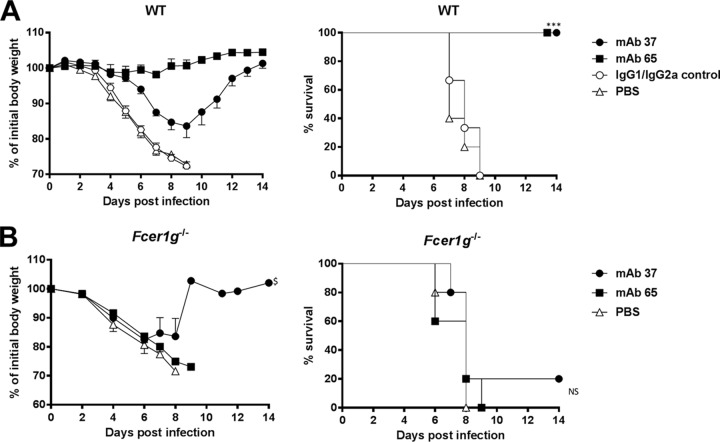
M2e-specific IgG2a protects better than M2e-specific IgG1, and protection depends on FcRγ. (A) M2e-specific IgG2a protects against influenza A virus challenge better than M2e-specific IgG1. Wild-type (WT) BALB/c mice received 5 mg/kg of either MAb 37 (IgG1) or MAb 65 (IgG2a) by intraperitoneal injection. The IgG1/IgG2a control group was treated with 2.5 mg/kg of control IgG1 and 2.5 mg/kg of control IgG2a per mouse. Twenty-four hours later, the mice were challenged with 4 LD50 of mouse-adapted X47 virus. Body weight (left) and survival (right) were monitored for 2 weeks after challenge. In the left-hand graph, data points represent averages, and error bars represent the standard errors of the means. Differences in body weight between the negative-control groups, on the one hand, and the MAb 37- and MAb 65-treated groups, on the other hand, were statistically significant (P < 0.001, REML variance components analysis; n = 6 mice per group on day 0). The differences in body weight curves between groups that received MAb 37 or MAb 65 were statistically significant (P < 0.001, REML variance components analysis). The survival rate of the mice that received MAb 65 or MAb 37 was significantly different from that of mice in the control groups (***, P < 0.001, log-rank test). The results represent those from one out of two repeat experiments, which had similar results. (B) M2e-specific MAbs fail to protect mice lacking the Fc common γ chain. Fcer1g−/− BALB/c mice were treated with 5 mg/kg of MAb 37, MAb 65, or PBS by intraperitoneal injection. Twenty-four hours later, the mice were challenged with 4 LD50 of mouse-adapted X47 virus. Body weight (left) and survival (right) were monitored for 2 weeks after challenge. In the left-hand graph, data points represent averages and error bars represent the standard errors of the means. $, starting from day 9 after infection, data were based on only one surviving mouse. The survival rates of the groups that received MAb 37 or MAb 65 were not significantly different from those for the control groups (P > 0.05, log-rank test; n = 5 mice per group on day 0). NS, not significant.

