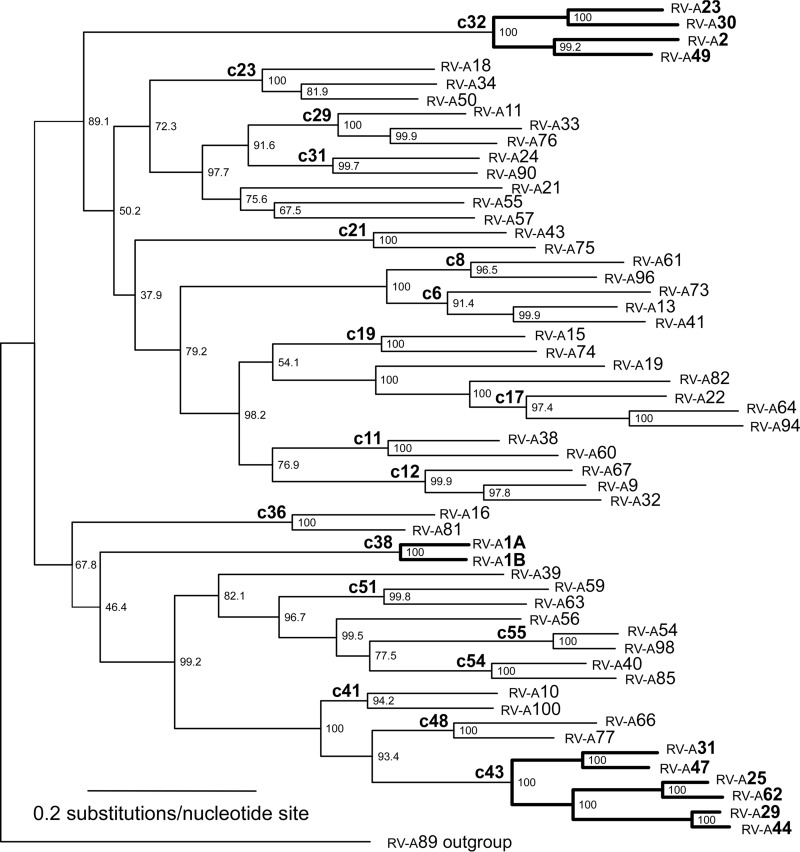
FIG 2.
Maximum likelihood estimate of phylogenetic relationships among minor-group (boldface type) and major-group serotypes using VP2, VP3, and VP1 capsid sequences concatenated in a single data set with the GTR+I+G model of evolution and being rooted with RV-A89. The 19 cladelets used for all statistical analyses are indicated by clade names in the form of cXX, where XX is the number derived from the numbering of internal nodes in the tree. Branch lengths are shown proportional to the amount of evolutionary change. Numbers to the right of the branch nodes indicate the bootstrap proportions. Labels at the tips of the branches are numbered according to each rhinovirus serotype.

