
FIG 4.
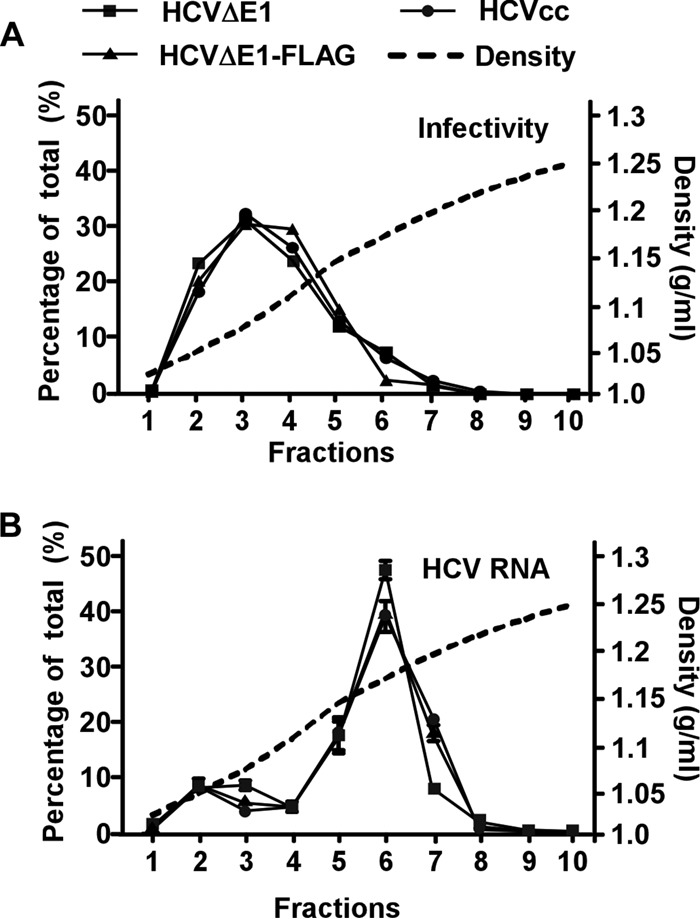
Characterization of the buoyant densities of HCVΔE1 and HCVΔE1-FLAG particles. The different HCV particles (HCVcc, HCVΔE1, and HCVΔE1-FLAG) were subjected to a 20% to 60% sucrose gradient. Ten fractions were collected from the top. The HCV RNA levels (A) and infectivity titers (B) of each fraction were determined by a titration assay and RT-qPCR, respectively. The results are expressed as the percentages of each fraction of the total. The density of each fraction was determined by measuring the mass of a 100-μl aliquot of the fraction. The data are representative of results from four independent experiments, and the error bars were calculated from duplicative RT-qPCR analyses.