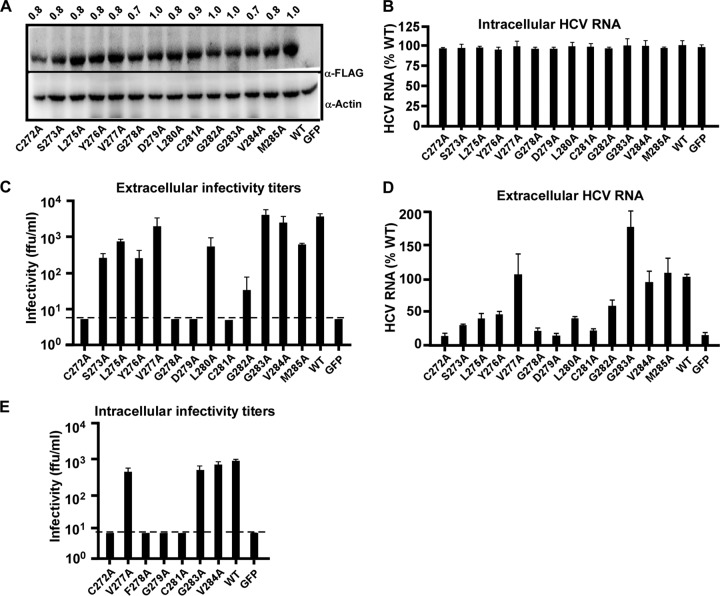
FIG 7.
Identification of key amino acid residues within the putative fusion peptide of E1. (A) Western blot analysis of E1 expression in Huh7.5.1 cells that were transduced by a lentiviral vector expressing wild-type or mutant E1 proteins. The amount of E1-FLAG was quantified by using ImageJ software, normalized to the value for actin, and expressed as a value relative to that of the wild type and is shown on the top. (B to D) Huh7.5.1 cells expressing wild-type E1 (WT), E1 with an individual alanine point mutation within the FP, or the GFP control were infected with HCVΔE1 at an MOI of 2. The cells or culture supernatants were collected at day 3 postinfection for the following analyses. (B) The quantities of intracellular HCV RNA were measured by RT-qPCR and are expressed as a percentage of the values for the wild type. (C) Extracellular infectivity titers. The dashed line indicates the detection limit of the titration assay. (D) Extracellular HCV RNA levels were measured by RT-qPCR and are expressed as a percentage of the value for the wild type. (E) Intracellular infectivity titers of selected E1 mutants. The dashed line indicates the detection limit of the titration assay. For panels D to G, the error bars were derived from three independent experiments.

