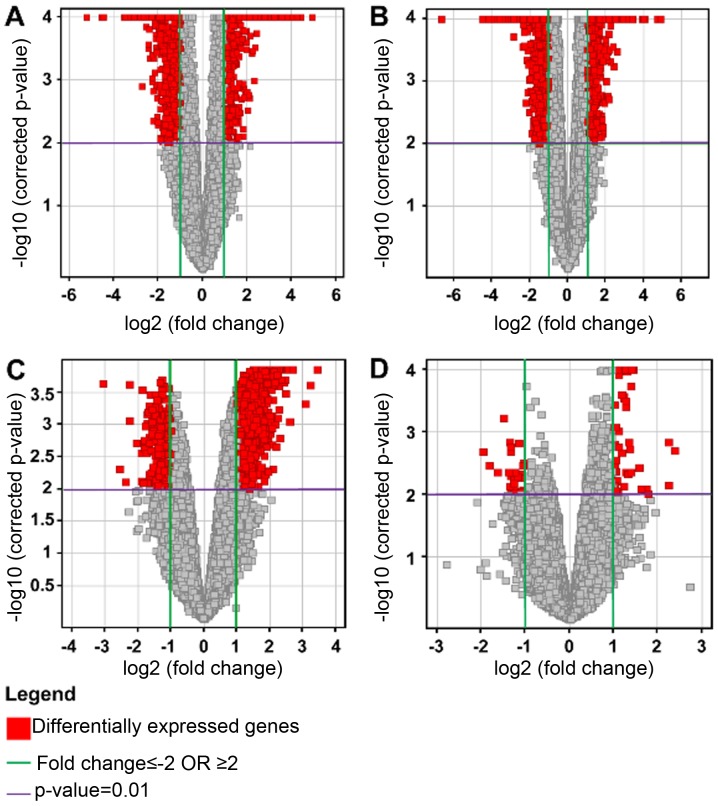
Figure 4.
Volcano plots to determine differentially expressed genes for the individual pairs of conditions: (A) HG vs. C; (B) LG vs. C; (C) HG vs. LG; and (D) NG vs. C. The x-axis represents the log2 fold change of genes for the different condition pairs, while the y-axis represents the - log10 of the corrected P-values for the different pairs of conditions. Each dot represents a gene and the red coloured area represents the differentially expressed genes that met the selection criteria of a fold change (FC) of at least 2 (FC≥2 or ≤2) and a P<0.01.

