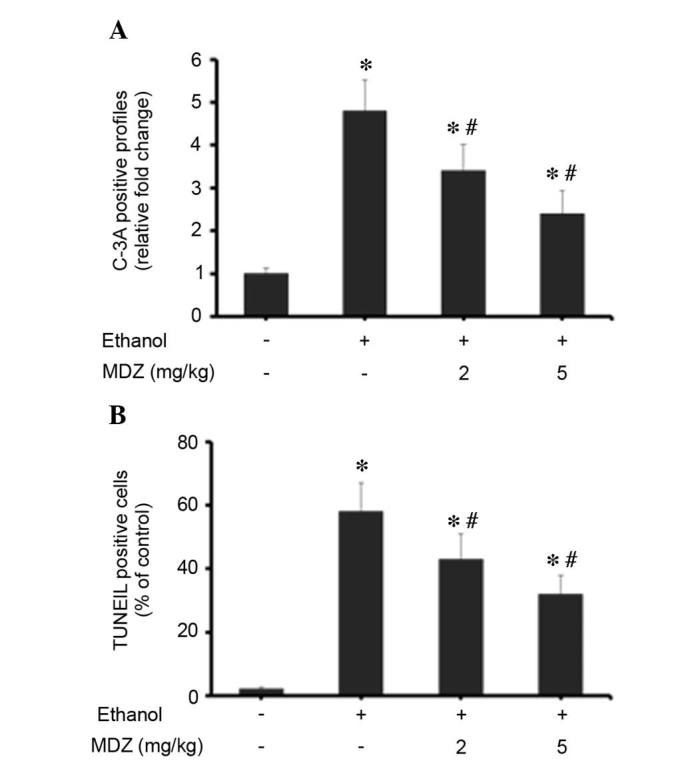
Figure 6.

Effects of midazolam on ethanol-induced neuroapoptosis in mice. (A) Immunohistochemical analysis of brain sections (n=5/group) was performed using anti-C-3A and was visualized using 3,3′-diaminobenzidine chromogen. The C-3A positive staining was documented under a light microscope and scoring of C-3A-positive cells per mm2 brain sections was performed. The total number of C-3A-positive cells was presented as the percentage of positive cells compared to the control group. (B) TUNEL staining of brain sections (n=5/group) was performed and analyzed. Data are presented as the mean ± standard deviation. *P<0.05 vs. control group, #P<0.05 vs. the MCAO group. MDZ, midazolam; C-3A, active caspase-3; TUNEL, terminal deoxynucleotidyl transferase dUTP nick end labeling.
