Figure 7.

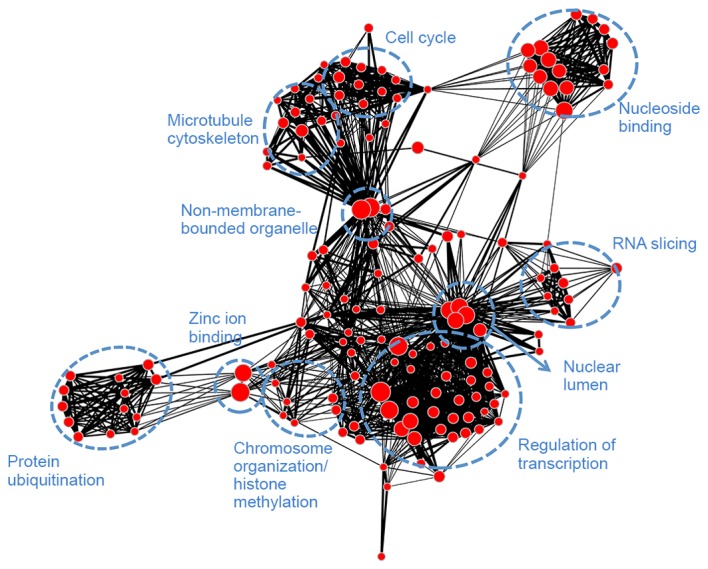
Gene ontology-annotation enrichment map for module brown. Nodes represent annotation terms and lines indicate the linked two annotation terms share >50% common genes.

Gene ontology-annotation enrichment map for module brown. Nodes represent annotation terms and lines indicate the linked two annotation terms share >50% common genes.