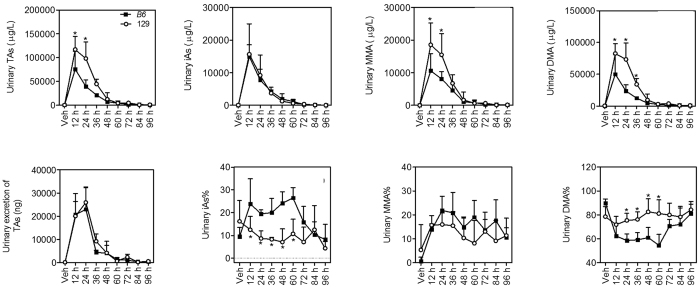
Figure 8. Arsenic concentrations and profiles in the urine in B6 (closed squares) and 129 (open circles) mice.
TAs was calculated as the sum of iAs, MMA and DMA. Urinary excretion of TAs was calculated by multiple urinary concentrations of TAs and urine amount. Values are expressed as mean + SD. *p < 0.05, compared with time-matched B6 mice. n = 5–6.

