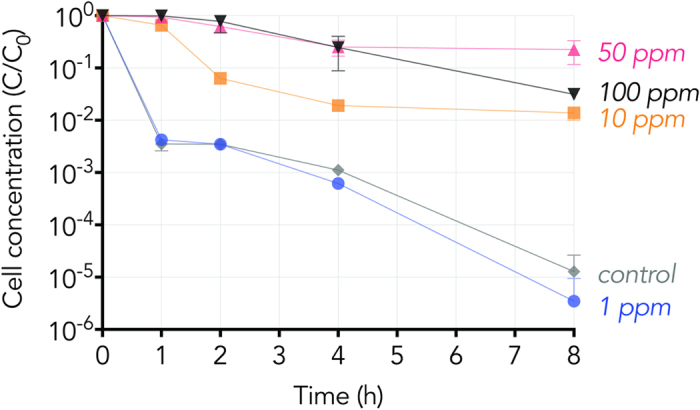
Figure 2.

Colony Forming Unit (C) over time normalized to the initial Colony Forming Unit of each series (C0) of B. subtilis in 5 mM NaHCO3 buffer (pH 7.7) with exposure to 100 ppm (black upside-down triangle), 50 ppm (pink triangle), 10 ppm (orange square), 1 ppm TiO2 (blue circle), and a no TiO2 control (grey diamond) in the absence of light. Each point represents the mean (n = 3) with error bars representing the 95% confidence interval. The marker obscures error bars that appear absent. The lower error bounds are missing from two data points, control at 8 hours and 1 ppm at 8 hours, because the bottom of the error bar would go to a negative value which cannot be shown on a logarithmic axis. Connecting lines are provided to guide the eye.
