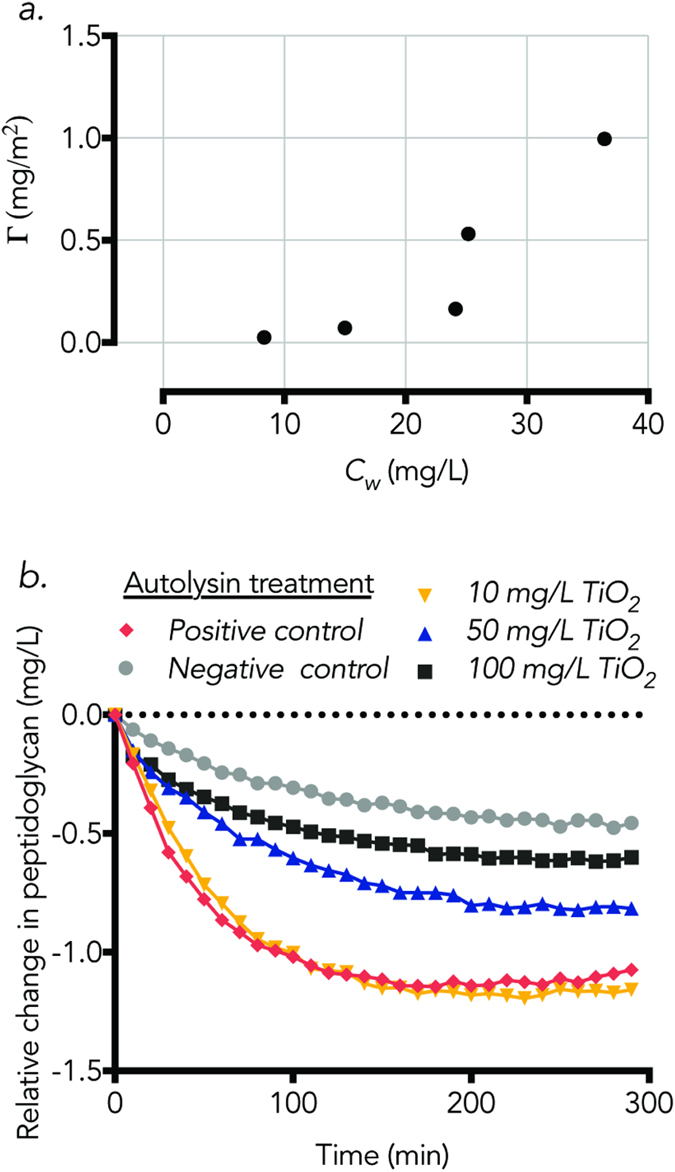
Figure 6.

(a) Adsorption isotherm of cell wall enzyme extract on TiO2 NPs at pH 7.7 and 25 °C with the surface area concentration, Γ, plotted against the concentration of free enzyme in solution, Cw. (b) Relative change in in peptidoglycan over time after incubation with cell wall associated enzymes. Prior to exposure to peptidoglycan, cell wall associated enzymes were incubated with varying concentrations of TiO2 NPs, which are denoted with distinct markers. The Negative control peptidoglycan was not exposed to any cell wall associated enzymes. The Positive control peptidoglycan was exposed to autolysins that were not incubated with TiO2 NPs. The dotted line represents the baseline of initial peptidoglycan concentration. Connecting lines are provided to guide the eye.
