Figure 1.

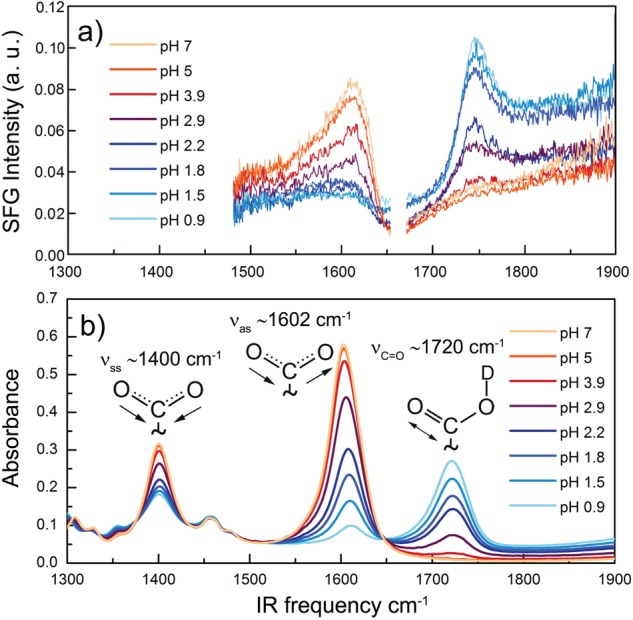
Spectra of l-proline in the frequency region of the carbonyl and carboxylate anion vibrations a) VSFG and b) ATR spectra at different pH values. The white area in the VSFG spectra represents a region where no VSFG response was measured.

Spectra of l-proline in the frequency region of the carbonyl and carboxylate anion vibrations a) VSFG and b) ATR spectra at different pH values. The white area in the VSFG spectra represents a region where no VSFG response was measured.