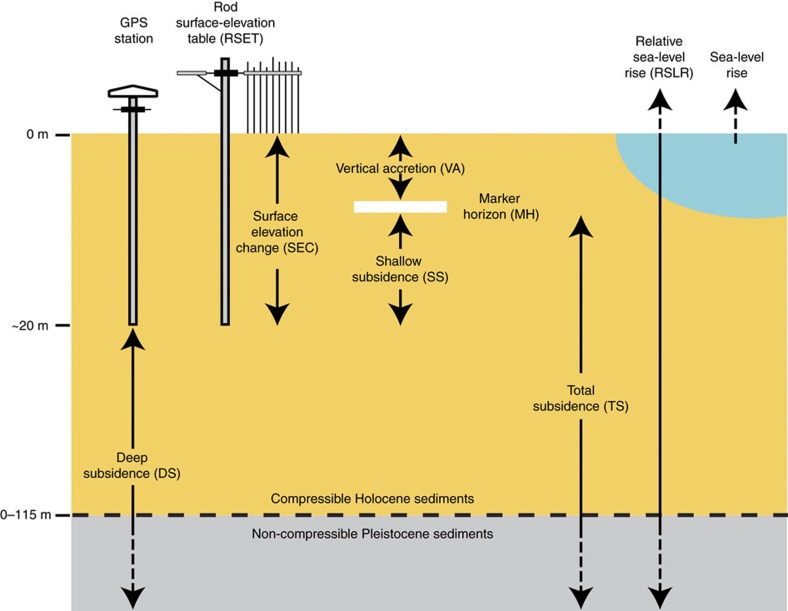
Figure 1. Relationship between study variables.
Representation of SEC, VA, SS (VA−SEC), DS, TS (SS+DS), sea-level rise and RSLR (TS+sea-level rise) as used in this study. When the VA rate exceeds the rate of RSLR there is an accretion surplus; when the VA rate is less than the rate of RSLR there is an accretion deficit. Figure is not to scale. Modified from ref. 22.

