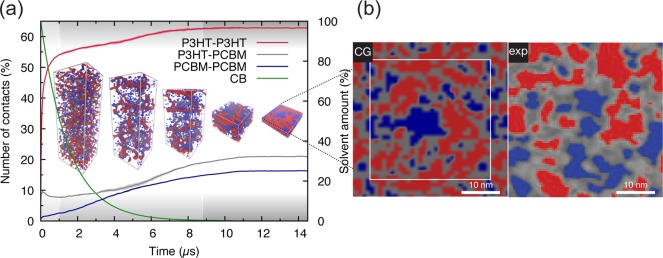
Figure 2.
Simulation of the evolution of a P3HT:PCBM bulk heterojunction during solution-processing (a) and comparison to experimental data (b). The evolution of P3HT-P3HT, P3HT-PCBM, and PCBM–PCBM contacts and of the solvent amount during drying are plotted (a), and snapshots at different times during the simulation are shown (P3HT chains are rendered in red while PCBM molecules are in blue; solvent molecules are not shown for clarity). The three stages of BHJ morphology evolution (see text) are indicated with different shades of gray. (b) Visual comparison between a spatially discretized morphology obtained via the solvent evaporation protocol (left-hand side; the thin white square shows the repeating unit cell) and a spin-coated blend imaged by EFSEM (right-hand side; close up of Figure 7c of ref (38), reproduced under the Creative Commons Attribution 4.0 International License).

