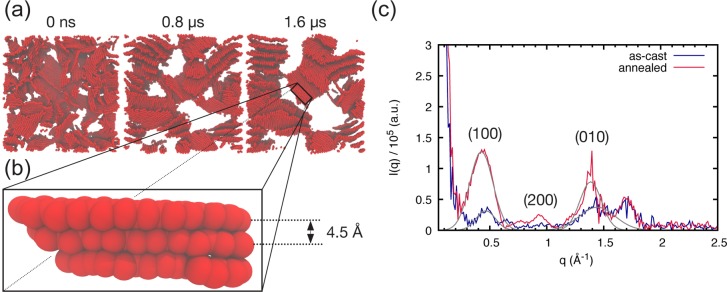
Figure 4.
Morphology evolution during thermal annealing and associated computed scattering curves. Snaphots at different times during the annealing process (a) where only the P3HT backbones are shown. White areas denote the location of P3HT side chains or PCBM domains (compare to Figure S2). A zoom in on the blend reveals a stack of 3 P3HT chains (b) reporting the observed CG stacking distance of 4.5 Å. (c) The corresponding computed scattering profiles are shown; Gaussian fits to the (100) and (010) peaks are shown in gray.

