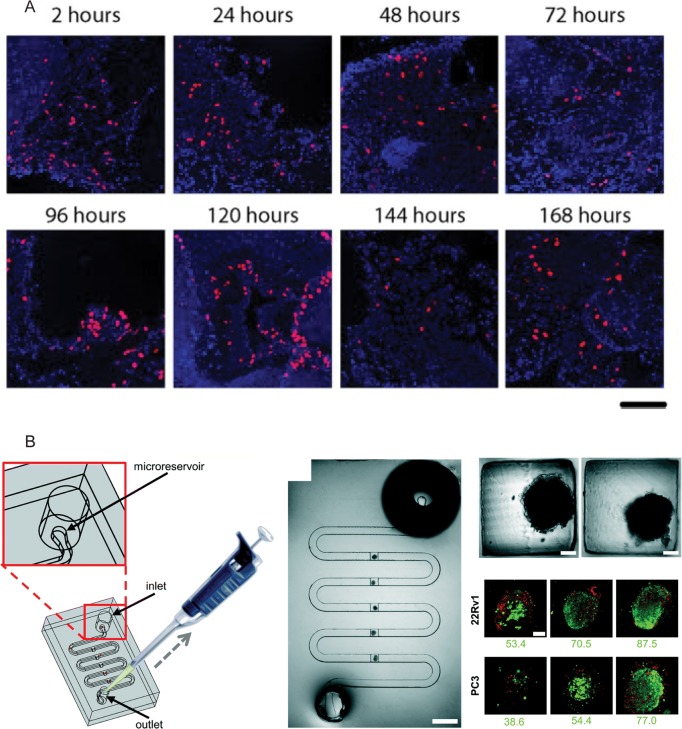
Figure 3.
Examples of tumor explant cultures (A) 7-day culture of 300 μm tumor slices obtained from a single tumor. The tumor slices were cultured under constant orbital movement. Blue, nuclear staining, DAPI; Red, DNA synthesis marker, EdU. The scale bar indicates 100 μm. Reprinted from Naipal et al. (2015), under the Creative Commons Attribution 4.0 International License.62 (B) Microfluidic platform for the study of microdissected tissues. Left: Schematic showing the structure of the microfluidic platform and the loading approach using a micropipette tip. Middle: Picture of the microfluidic device containing microdissected tumor tissues that were captured in the square traps. The scale bar indicates 2 mm. Top right: Zoomed image of microdissected tumor tissues captured in the square traps. The scale bars indicate 100 μm. Bottom right: Microdissected tumor tissues of 22Rv1 or PC3 xenografts were analyzed by confocal microscopy (maximum projection images) and by flow cytometry. The viability of nontreated microdissected tissues for each sample is given below the respective image. The dye for viability was Cell Tracker Green (green) and for dead cells propidium iodide (red). Reprinted from Astolfi et al. (2016), under the Creative Commons Attribution 4.0 International License.64 EdU, 5-ethynyl-2′-deoxyuridine.

