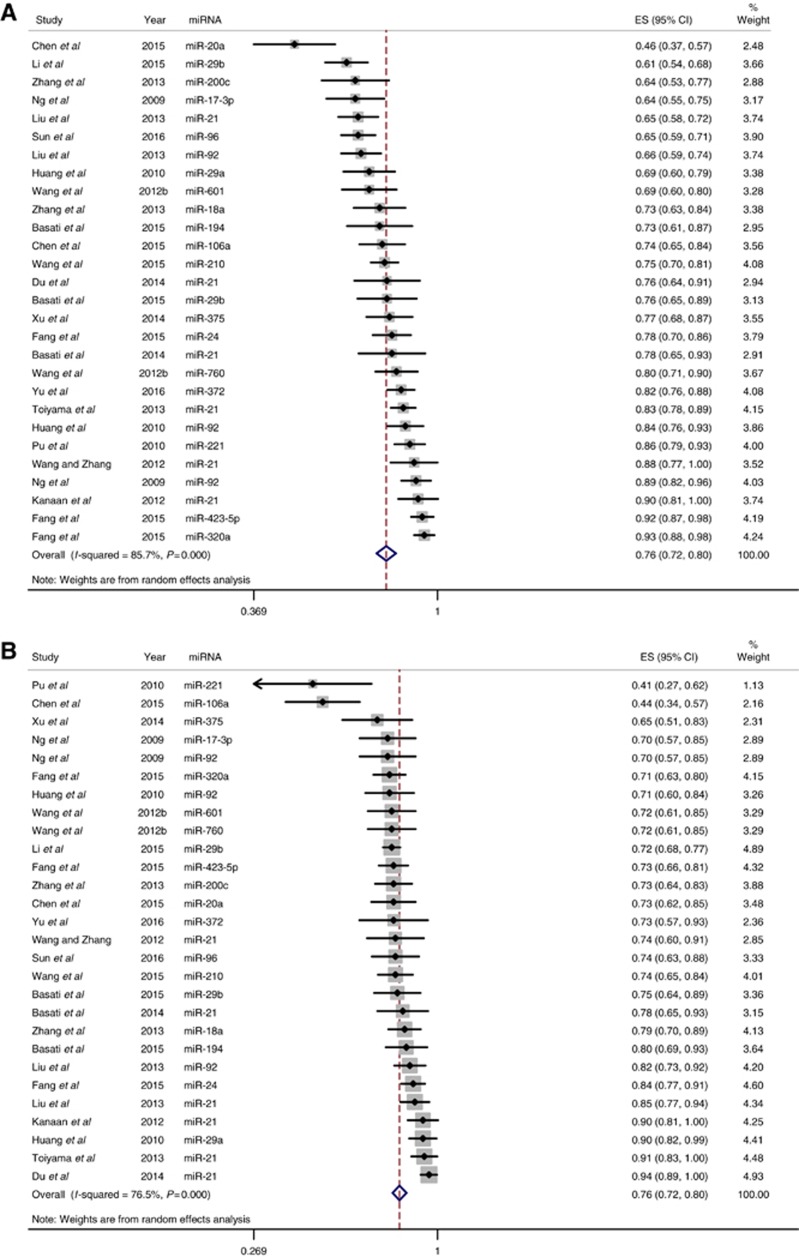
Figure 3.
Forest plots for studies on individual miRNA assays used in the diagnosis of CRC among the 19 studies included in the meta-analysis. (A) Estimates of sensitivity. (B) Estimates of specificity. A full color version of this figure is available at the British Journal of Cancer journal online.

