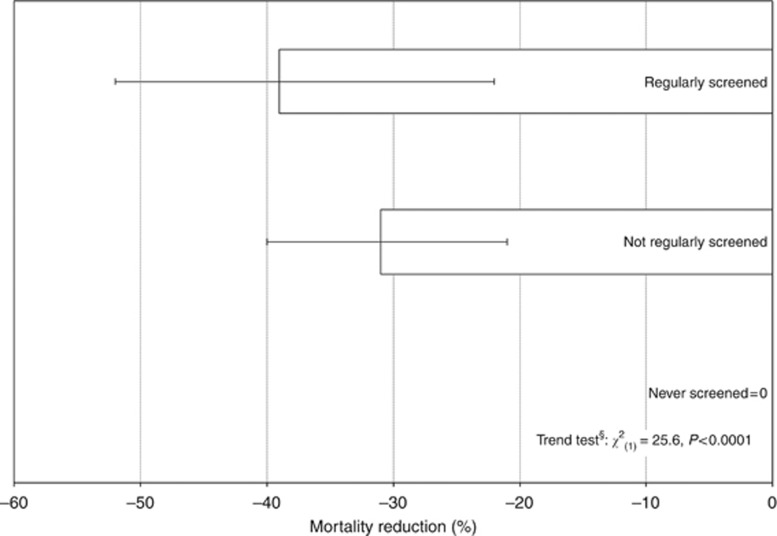
Figure 2.
Differences (%)† in breast cancer mortality by mammography screening group, New Zealand women, 1999–2011. †Adjusted for age and ethnicity by regression; and adjusted for screening selection bias (Duffy et al, 2002a) assuming relative risk in non-screeners to women not offered screening=1.17 and recorded screening participation rate of 71% for 2012–2013. §Trend test of regression estimates.

