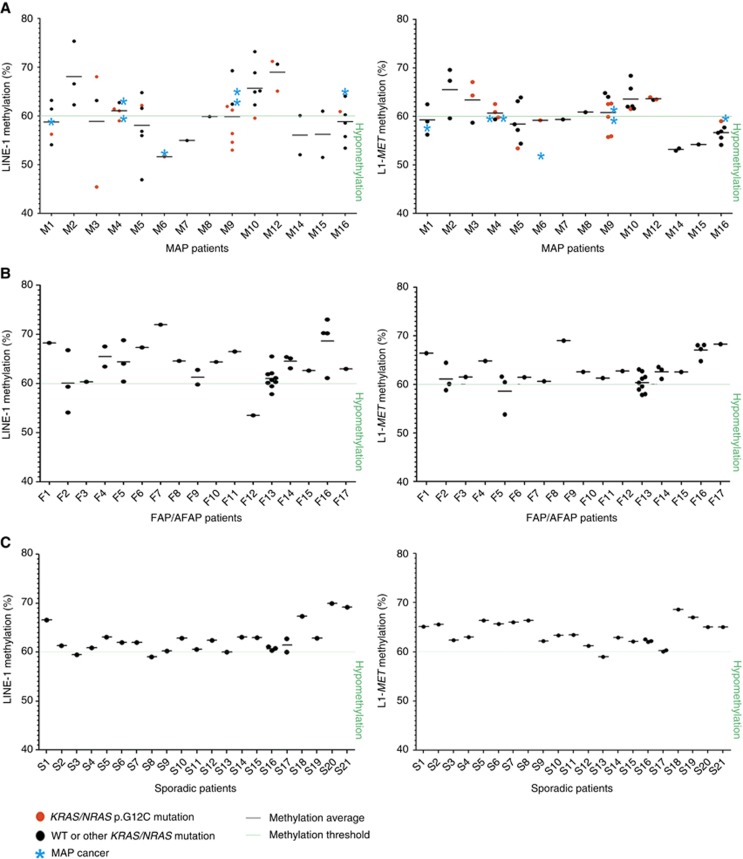
Figure 4.
(A) Dot plots represent LINE-1 and L1-MET methylation percentages in adenomas of single MAP, (B) FAP/AFAP and (C) sporadic patients; black dots identify adenomas and red dots indicate KRAS/NRAS p.G12C-mutated polyps; the green line symbolises the methylation threshold (60%) for LINE-1 and L1-MET assays; bars show the mean values of LINE-1 or L1-MET methylation percentages among adenomas of the same patient and light blue asterisks show the methylation level of the corresponding carcinomas; symbols and colours are reported as per the legend below. WT, wild type. A full color version of this figure is available at the British Journal of Cancer journal online.

