. 2016 Jul 12;7(11):6839–6845. doi: 10.1039/c6sc02335e

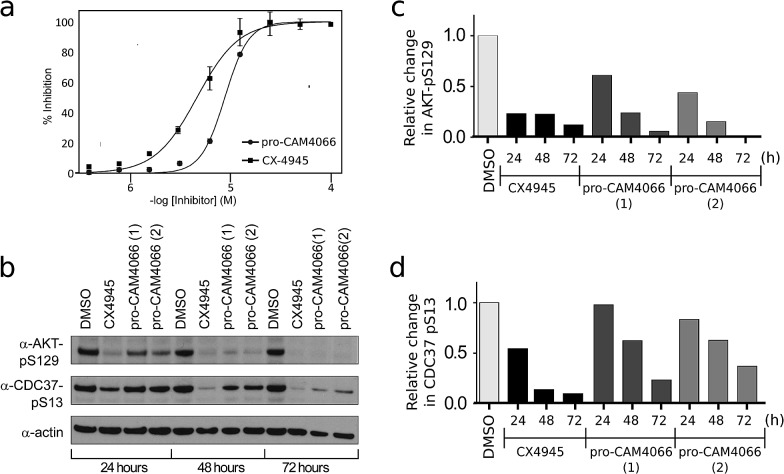
Fig. 4. (a) Dose response curve for the inhibition of the growth of HCT116 cells by pro-CAM4066 and CX4945. CX4945 has a GI50 of 4.8 μM and pro-CAM4066 has a GI50 of 8.8 μM (graph for CX4945 shows the mean ± SEM of four independent experiments with each compound concentration in triplicate, and the graph for pro-CAM4066 shows the mean ± SEM of three experiments with each concentration in triplicate). (b) Western blot analysis showing the specific CK2 phosphorylation targets of AKT1 phosphoserine 129 and Cdc37 phosphoserine 13. HCT116 cells were treated with 2 × GI50 of CX4945 (10 μM) or 8 (20 μM) for 24, 48 or 72 hours. For pro-CAM4066 data is shown for two different experiments performed with different batches of inhibitor. (c) and (d) Show results of quantification of the Western blot shown in (b) for AKT1 phosphoserine 129 and Cdc37 phosphoserine 13, respectively. Data are normalised to actin loading control and to DMSO only sample.

Fig. 4