
Figure 3.
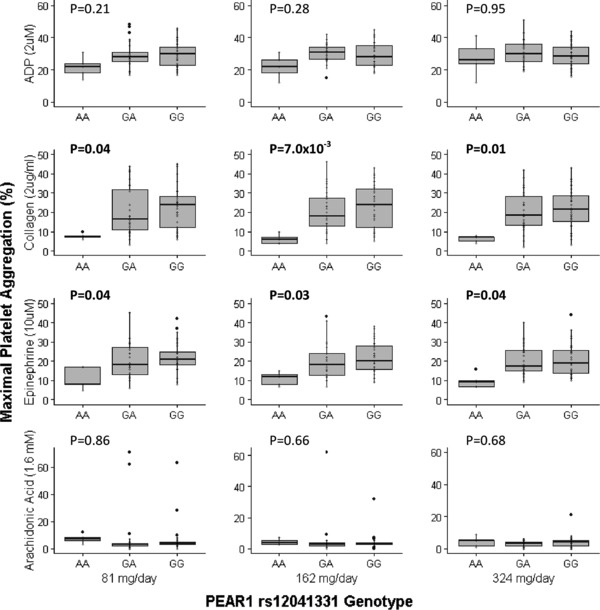
On‐aspirin agonist‐induced ex vivo platelet aggregation measurements were obtained in platelet‐rich plasma on day 7 of each treatment period 2 h following administration of the final aspirin dose. Aspirin doses of 81 mg, 162 mg, and 324 mg were administered for 7 days. Platelet aggregation is expressed as the percentage of maximal aggregation using platelet‐poor plasma as a referent. Adenosine diphosphate (ADP; 2 μM), collagen (2 μg/mL), epinephrine (10 μM), and arachidonic acid (AA; 1.6 mM) were used to stimulate platelet aggregation. The horizontal line within each box indicates the median; the top and bottom borders of each box indicate the interquartile range (IQR). The whiskers extending from each box indicate plus/minus 1.5 IQRs and the points beyond the whiskers indicate outliers beyond 1.5 IQRs.