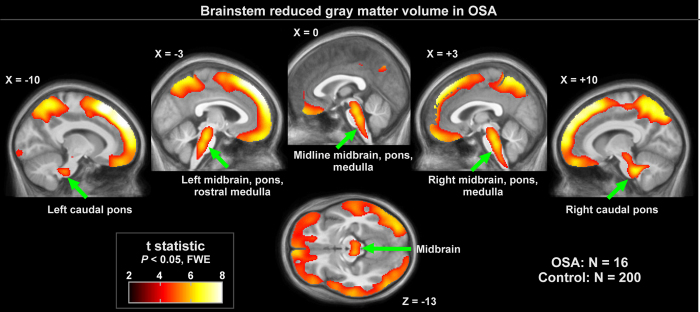
Figure 1. Brainstem regions of significantly lower regional grey matter volume in OSA (n = 16) over control (n = 200) subjects (P < 0.01), colored according to significance level.
Background is the average of the 216 subjects’ normalized T1-weighted brain scans. Slice locations are in MNI coordinates.

