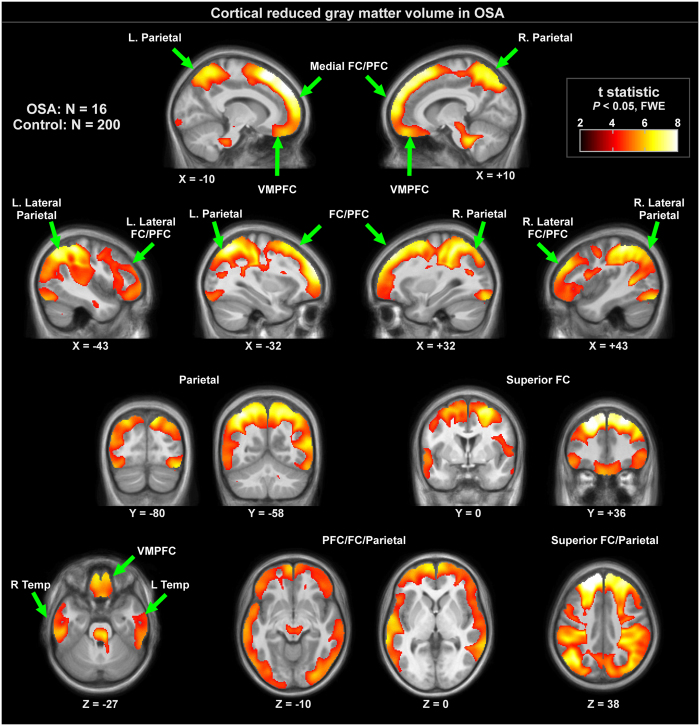
Figure 2. Cortical regions with significantly lower regional grey matter volume in 16 OSA compared to 200 control subjects (P < 0.01), colored according to significance level.
Background is the average anatomical of 216 subjects. Slice locations are in MNI coordinates. Key: L left, R right, FC frontal cortex, PFC prefrontal cortex, VMPFC ventral medial prefrontal cortex.

