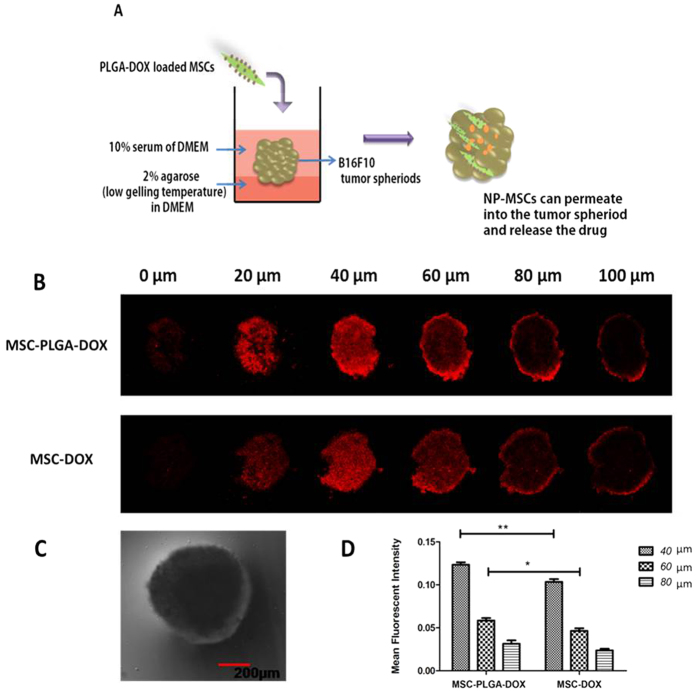
Figure 7. Penetration of loaded MSCs into B16F10 tumor spheroids.
(A) Schematic diagram of experiment design. (B) Confocal laser scanning images of B16F10 tumor spheroids after incubated with DOX or PLGA-DOX loaded MSCs for 48 h ranging from 0–100 μm. (C) A representative image of B16F10 tumor spheroid in bright field with a spherical shape. (D) Mean fluorescence intensity calculated by Image J software at the depth of 40, 60, 80 μm. Data were presented as mean ± standard deviation, (n = 3 replicates for each group). *p < 0.05, **p < 0.01.

