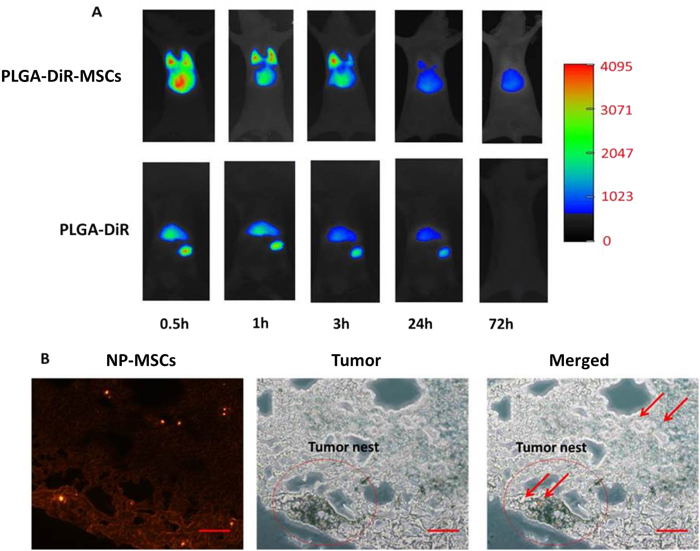
Figure 8. In vivo distribution of NP-MSCs.
(A) In vivo fluorescence images of MSCs-PLGA-DiR and PLGA-DiR in lung melanoma metastasis-bearing mice after intravenous injection at determined time points (0.5, 1, 3, 24, 72 hrs). (B) Fluorescence images of frozen lung section with PLGA-DOX loaded MSCs on day 3 after drug injection. (Scale bar = 100 μm).

