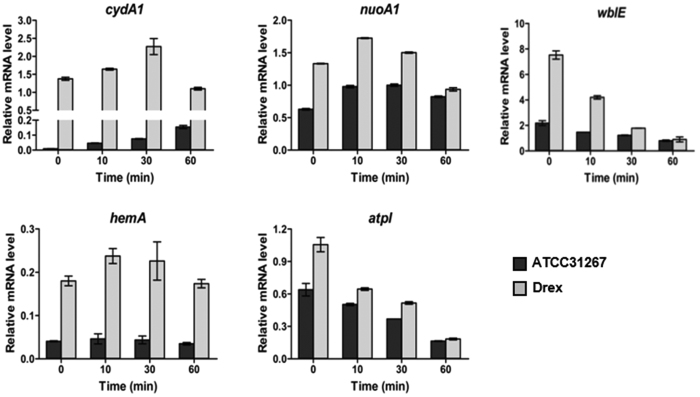
Figure 2. RT-qPCR analysis of transcription levels of cydA1, nuoA1, hemA, atpI, and wblE in ATCC31267 and Drex.
RNA was prepared from cells grown in fermentation medium for 3 days on a rotary shaker (250 rpm) and then static-cultured for the indicated time. Quantitative data were normalized to hrdB (SAV2444) expression value. Values shown are mean ± SD from three replicates.

