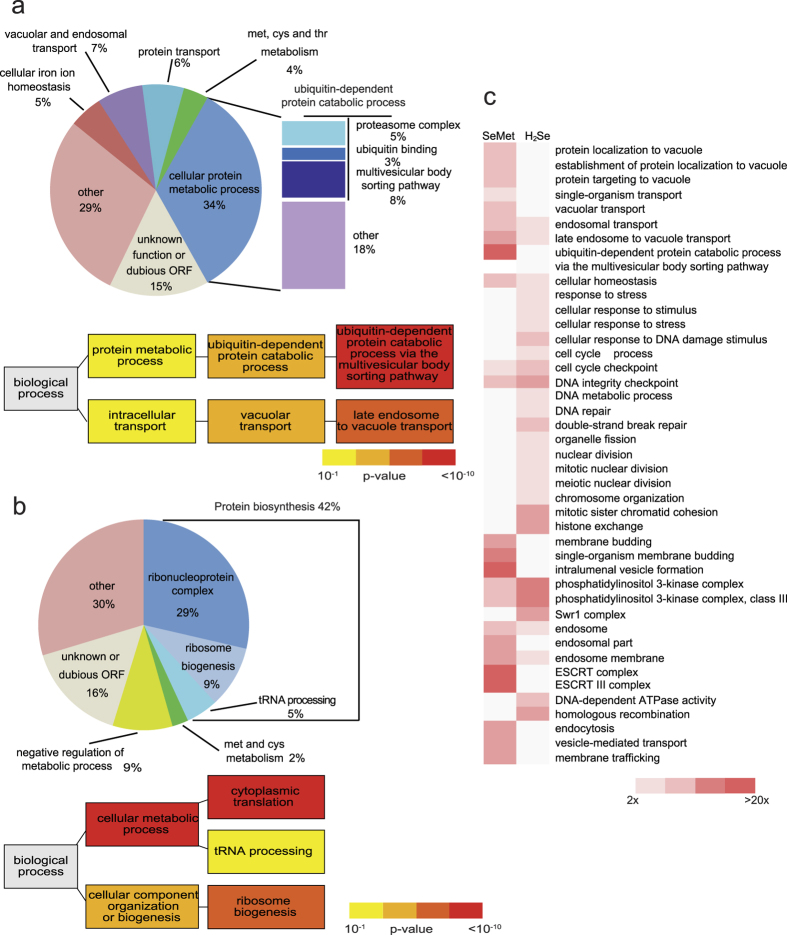
Figure 1. GO term analysis of the SeMet-sensitive and -resistant datasets.
(a) Distribution of SeMet-sensitive mutants according to biological processes affected (upper panel). Hierarchical graph of GO terms enrichment relative to the genome (lower panel). (b) Distribution of SeMet-resistant mutants according to biological processes affected (upper panel). Hierarchical graph of GO terms enrichment relative to the genome (lower panel). The color indicates the p-value of the enrichment according to g:Profiler (yellow: 10−1–10−3, orange: 10−3–10−6, light red: 10−6–10−10, dark red: <10−10). (c) Functional categories significantly enriched (p < 0.001, fold enrichment >2) in the SeMet- or H2Se-sentitive datasets. Only genes for which fitness scores were available in both screens were taken in consideration (137 and 135 genes in the SeMet and H2Se datasets, respectively). The color indicates the fold enrichment for each category. Blank boxes indicates an enrichment <2.

