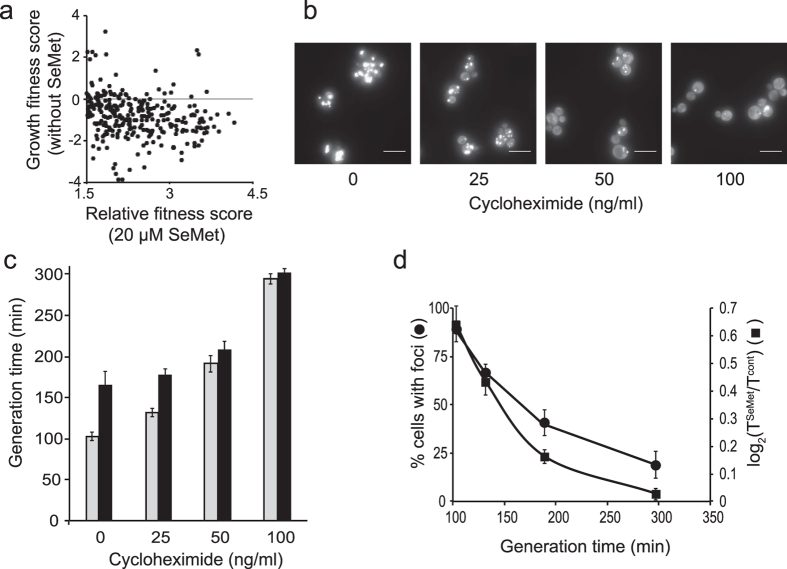
Figure 3. Reduced growth rates affect SeMet toxicity and protein aggregation.
(a) Relationship between SeMet resistance and growth in the absence of SeMet. Dots correspond to the growth fitness score in the absence of SeMet versus the relative fitness score in the presence of 20 μM SeMet, for strains resistant to SeMet (fitness score >1.5). (b) Effect of low cycloheximide concentrations on protein aggregation. Cycloheximide at the indicated concentrations was added to BY4741-Hsp104-GFP cells grown in SC + 100 μM methionine. After 1 h of incubation, 20 μM SeMet was added in the cultures and incubation was continued for 1 h. Hsp104-GFP localization was monitored in living cells by fluorescence microscopy. Representative images obtained after maximum intensity z-projection, bar equals 10 μm. (c) Generation times of BY4741 cells cultured in SC + 100 μM methionine at the indicated concentrations of cycloheximide in the absence (grey boxes) or presence (black boxes) of 20 μM SeMet. The results are the mean and range of at least 2 experiments. (d) Effect of reducing growth rates on SeMet toxicity and protein aggregation. The fraction of cells containing at least one Hsp104-GFP focus (⚫) was determined from the images in panel b, by visual inspection of 150–200 cells in each condition. SeMet growth inhibition (◼) was calculated as the log2(TSeMet/Tcont) value where TSeMet and Tcont are the generation times, calculated for each cycloheximide concentrations in panel c, in the presence and absence of SeMet, respectively. Values were plotted against the generation time in the absence of SeMet (Tcont). The results are the mean and range of at least 2 experiments.

