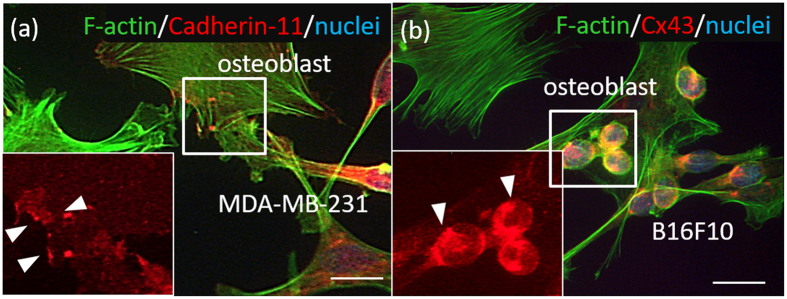
Figure 4. Visualization of intercellular adhesion between cancer cells and osteoblasts cultured on culture dish.
(a) Cadherin-11 is positively expressed in the osteoblasts and MDA-MB-231. Green: F-actin, red: Cadherin-11, blue: nuclei. (b) Connexin 43 is expressed in the osteoblasts and B16F10. Green: F-actin, red: Cx43, blue: nuclei. Scale bar: 30 μm.

