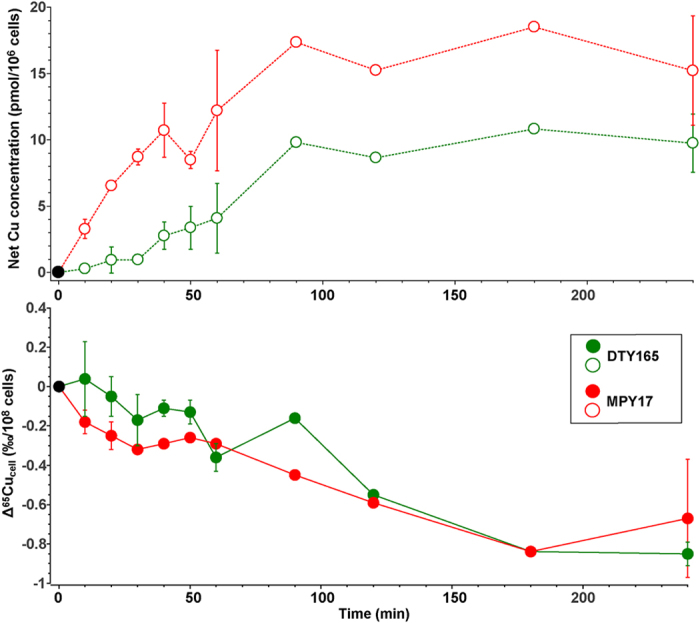
Figure 2. Net variations of the Cu concentration and isotopic composition in S. cerevisiae for the wild-type (green) and the Δctr1Δctr3 double-knockout strain (red).

Upper panel: variations of the Cu concentration over 240 min. during uptake experiments. Values are reported as the difference Cu(t) − Cu(t = 0) normalized to 108 cells (see text for details). Lower panel: variations of the Cu isotopic composition (reported as Δ65Cucell = δ65Cu(t) − δ65Cu(t = 0), see text for details) normalized to 108 cells. The error bars are the standard deviation between independent experiments (see Table S1 for details).
