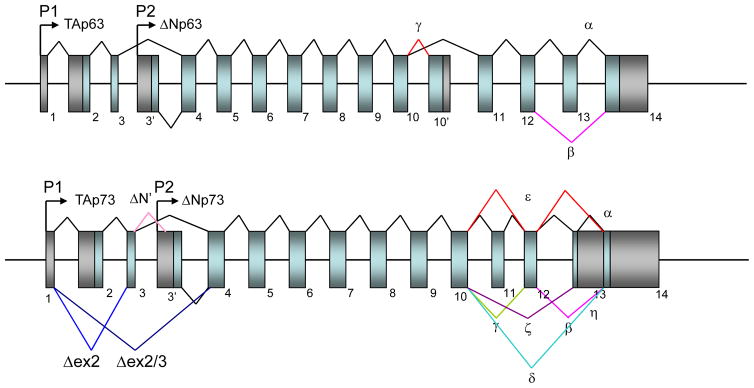
Figure 1. Genomic structure of the p63 and p73 loci.
Genomic structures of human p63 and p73 loci. Numbered boxes indicate exons, black shading denotes untranslated sequences, and light blue shading denotes coding regions. Distinct transcription start sites (P1 and P2) are indicated by arrows. N-terminal alternative splicing for p63 and p73 are indicated by blue and light pink lines, and C-terminal splicing events for these proteins are indicated by different colored lines.

